Finding Your Average Order Value in Shopify (And Why It Matters)
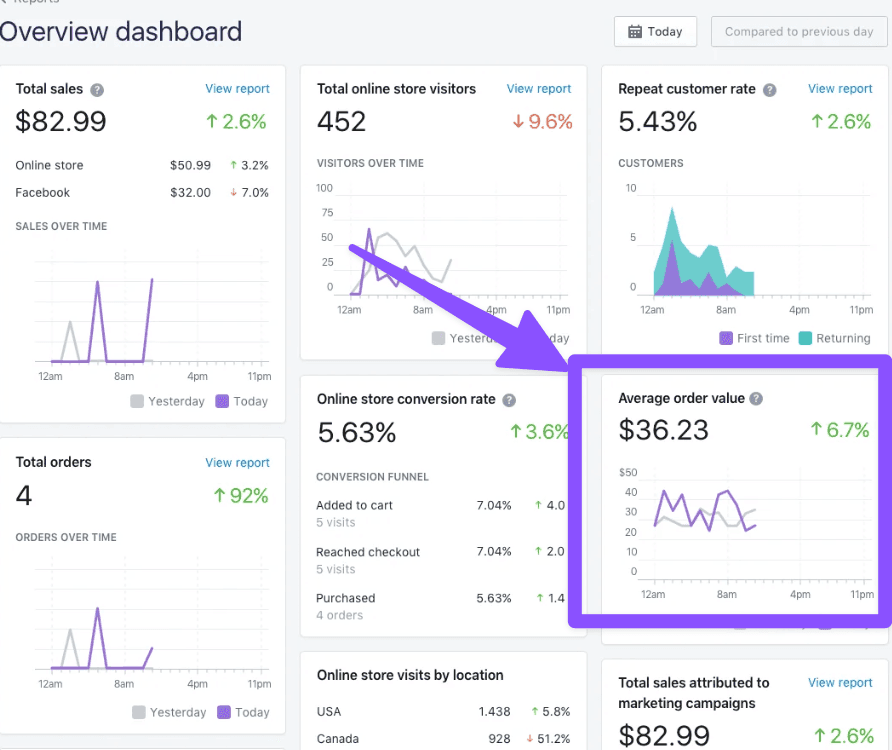
Find your Average Order Value (AOV) in your Shopify reports. Navigate to the Analytics section from your Shopify admin dashboard, then select Reports. Your store’s AOV is a key metric displayed on the main sales reports. You can also adjust the date range to analyze your AOV over specific periods.
First, the easy part. To find your Average Order Value (AOV), just log into your Shopify admin, head to Analytics, and then click on Reports. It’s right there on the main sales report dashboard. You can tweak the date range to see how it’s trended over the last month, the last quarter, or during a specific sales event.
Done. That’s the “how.”

But just knowing the number is barely scratching the surface. The real work is in understanding what that number is telling you about customer behavior and, more importantly, how to systematically increase it. Optimizing your AOV is one of the most powerful levers you can pull to grow revenue without sinking more money into customer acquisition. It’s about increasing the value of the customers you already have. This is a deep dive into how to find it, calculate it properly, and actually use it to make your store more profitable.
What Exactly is Average Order Value?
At its core, Average Order Value is a simple metric: it’s the average dollar amount a customer spends every time they place an order on your store over a specific period. It’s a direct pulse on your customers’ spending habits. A rising AOV is a fantastic sign, it means customers are either buying more products per transaction, more expensive products, or both.
It’s one of the big three e-commerce metrics, right alongside traffic (your number of customers) and conversion rate. While everyone chases more traffic and better conversions, AOV is often the most cost-effective way to boost the bottom line. You’ve already done the hard work of getting the customer to your site and convincing them to buy; increasing AOV is about maximizing that moment.
The raw number, however… it can be misleading on its own. A store-wide AOV doesn’t tell you who is spending more or why. That’s where the strategic value comes in. By digging into the data, AOV analysis informs everything from marketing and product development to pricing. It helps you answer critical questions:
- Which of my marketing channels are actually bringing in high-value customers, not just clicks?
- Should I bundle these two products together?
- Where should I set my free shipping threshold?
- Are my upsell apps actually working?
The AOV Formula: How to Calculate It Manually
While Shopify hands you the AOV on a silver platter in its reports, understanding the calculation is essential for any deeper analysis. You need to know what’s under the hood.
The formula is deceptively simple:
AOV = Total Sales Revenue / Total Number of Orders
Now, here’s the first bit of nuance, a self-correction, if you will. What does “Total Sales Revenue” actually mean? For a clean AOV calculation, you should be looking at your net sales revenue. This is your revenue after discounts have been taken out, but before you’ve added shipping fees and taxes. This is critical because you want to measure the value of the products sold, not the ancillary costs.
So, if your store did $50,000 in sales last month from 1,000 separate orders, the math is straightforward:
$50,000 / 1,000 Orders = $50 AOV
This tells you that, on average, a single transaction in that period was worth $50.
Going Deeper: Related Metrics in Shopify
AOV in a vacuum is just a number. Its true power is unlocked when you look at it alongside other metrics to get the full picture. The Shopify analytics dashboard has all this data, you just need to connect the dots.
Think about these metrics as different lenses to view your sales performance through:
| Metric / Method | Calculation / Description | Where to Find It in Shopify | Key Question It Answers |
|---|---|---|---|
| Average Order Value (AOV) | Total Sales Revenue / Total # of Orders | Analytics > Reports > Average order value | How much does a typical customer spend per order? |
| AOV by Traffic Source | AOV, but segmented by where the customer came from (e.g., Google, Instagram). | Analytics > Reports > Sales by traffic source | Which channels are delivering the most profitable customers? |
| AOV by Customer Cohort | Segmenting AOV by groups like first-time vs. returning customers. | Analytics > Reports > Returning customers | Are my loyal customers spending more than new ones? (They should be.) |
| Average Items per Order | Total Items Sold / Total # of Orders | Analytics > Reports > Average items per order | Are people buying one thing, or are they browsing and adding multiple items? |
| Customer Lifetime Value (CLV) | This is more complex, often needing an app, but it’s essentially: AOV x Purchase Frequency x Customer Lifespan. | Data is pulled from Customer reports. Apps like Lifetimely can calculate this automatically. | What is the total long-term value of a customer, not just a single sale? |
What’s a “Good” AOV? A Look at Industry Benchmarks
To know if your AOV is strong, you need context. A $50 AOV could be phenomenal for a store selling phone cases but disastrous for one selling custom furniture. Industry benchmarks are the yardstick you measure yourself against, but a word of caution: treat these as directional guides, not gospel. Your specific brand positioning, target audience, and product mix can cause huge variations.
- Fashion and Apparel: This can vary wildly. Fast fashion might see a lower AOV with multiple items, while a luxury brand might have a very high AOV from a single purchase.
- Health and Beauty: Often sees a moderate AOV, but relies heavily on repeat purchases. The real metric to watch here is CLV, which is often boosted by subscriptions.
- Home Goods and Furniture: Typically one of the highest AOV sectors. Purchases are infrequent, but the price point of a single item drives the value way up.
- Electronics: Another high-AOV industry. A single big-ticket item like a laptop is often the core of the order, and the AOV gets boosted by cross-selling accessories.
- Food and Beverage: Generally a lower AOV, driven by smaller, more frequent buys. The game here is often about subscriptions and bundling to get that basket size up.
7 Proven Ways to Increase Your Average Order Value
Alright, let’s get into the practical strategies. Increasing your AOV is about encouraging customers to add just a little bit more to their cart before they check out.
1. Product Bundling and Kits
This is a classic. Group related products together and sell them as a single package, usually at a slight discount. Think “Beginner’s Skincare Kit” or “The Complete Grilling Set.” It works because it increases perceived value and simplifies the decision-making process for the customer.
- You can use this to move slower-selling inventory by pairing it with a bestseller.
- It’s also a great way to introduce customers to products they might not have discovered on their own. Apps like “Bundles & Upsell” in the Shopify App Store can make setting this up a breeze.
2. Smart Upselling and Cross-selling
Upselling is persuading a customer to buy a more expensive version of a product (“Would you like the Pro model?”). Cross-selling is suggesting related or complementary items (“Customers who bought this camera also bought this lens”). The key thing to understand here is timing and relevance. Bombarding customers with pop-ups is a bad idea.
- A great place for a cross-sell is on the product page or even subtly in the cart.
- Post-purchase upsells are particularly effective. This is an offer you make after the customer has already paid but before they hit the “thank you” page. Since the initial transaction is secure, there’s zero risk of cart abandonment. They can add the item with one click.
3. A Strategic Free Shipping Threshold
“Free Shipping” are two of the most powerful words in e-commerce. You can leverage this by setting a minimum order value to qualify. The trick is to set it strategically. Find your current AOV—let’s say it’s $65—and set the threshold about 15-20% higher, maybe at $75. This feels achievable and nudges customers to add one more small item to their cart to avoid the shipping fee. You can set this up directly in your Shopify settings under Settings > Shipping and delivery.
4. Loyalty and Rewards Programs
A good loyalty program turns one-time buyers into repeat customers. And repeat customers, in most cases, have a higher AOV. By offering points for purchases, you create a system where customers are incentivized to spend more to reach the next reward tier. This builds a powerful sense of engagement that goes beyond a single transaction. Apps like Smile.io or Yotpo are the leaders in this space.
5. Volume Discounts (Tiered Pricing)
This one is simple and direct: the more a customer buys, the bigger the discount. “Buy 2, get 10% off; Buy 3 or more, get 15% off.” This is especially potent for consumable products or items people tend to buy in multiples. It directly incentivizes an increase in the number of items per order, which is a surefire way to lift your AOV.
6. “Buy Now, Pay Later” (BNPL) Options
Sticker shock is real. A $400 purchase can feel intimidating, but four payments of $100 feels much more manageable. By integrating services like Shop Pay Installments, Afterpay, or Klarna, you reduce that payment friction. This makes customers more comfortable with larger cart sizes, often leading them to purchase more than they would have otherwise. (Just be aware of the transaction fees these services charge and factor them into your margins).
7. Post-Purchase Offers
I mentioned this earlier, but it deserves its own spot. A post-purchase offer is presented after checkout is complete. The customer’s payment info is already stored, and their buying intent is at its peak. Presenting a relevant, one-click offer for a complementary product at this stage is an incredibly low-friction way to add revenue to an already completed sale.
From Tracking to Optimization: Making AOV a Process
Implementing these strategies is just the start. To get real, sustainable growth, you need to be constantly tracking, analyzing, and optimizing.
First, establish a baseline. Look at your AOV over the last 90 or 180 days. This is your starting line. Then, set a SMART goal, something like “Increase AOV by 10% in Q3 by implementing a $75 free shipping threshold and launching three new product bundles.”
Next, segment your AOV data. A single store-wide number hides the truth. The most valuable insights come from slicing the data:
- New vs. Returning Customers: Are repeat buyers spending more? If not, why?
- Traffic Source: Does traffic from your Instagram ads have a higher AOV than traffic from your email newsletter?
- Device Type: Is there a difference between desktop and mobile shoppers?
- Discount Usage: How much do heavy discount users’ AOV differ from full-price buyers?
Finally, A/B test everything. Don’t just guess what works. Test it. Create two versions of an offer and show them to different segments of your audience. Test a $75 free shipping threshold versus an $85 one. Test different product bundle combinations. Test the placement of your upsell recommendations. By changing only one variable at a time, you can attribute any lift in AOV directly to that change and build your strategy on a foundation of hard data, not just assumptions.
Commonly Asked Questions
Below are common questions we get asked.
Which Shopify report is best for getting the raw numbers for my AOV calculation?
The “Sales over time” report in your Shopify Analytics is the gold standard. It gives you the two numbers you need: total sales and the total number of orders for any given period. This is the cleanest source for doing any manual or segmented calculations.
Beyond AOV, what other metrics give the best context on customer value?
You absolutely have to look at Customer Lifetime Value (CLV) and Purchase Frequency. AOV tells you what a customer spends now, but CLV tells you what they’re worth over their entire relationship with your brand. A customer with a slightly lower AOV but a much higher purchase frequency might actually be more valuable in the long run. These three metrics together paint a full picture.
How does segmenting my customers actually change my AOV insights?
Segmenting is everything. A blended, store-wide AOV might be $80. But when you segment, you might find that new customers have an AOV of $60 while returning customers have an AOV of $110. That’s not just a data point; it’s a massive strategic insight. It tells you that your efforts should focus on turning new customers into repeat buyers, because that’s where the real value is. Without segmentation, that crucial detail is completely hidden.
Ready to Boost Your Shopify Store?
Increase revenue with video upsells and dominate search rankings with AI-powered SEO.
Related Articles
Creating Product Bundles In Shopify – Strategic Options
Create product bundles in Shopify by using an app. First, install the official Shopify Bundles app from the app store, or alternative apps such as Optizen Video Upsells. Inside the app, click “Create bundle” to begin. You then choose which products to include in your offer. Set a fixed price or a percentage discount, then […]
Proven Methods To Increase AOV In Your Shopify Or Ecommerce Store
Increase average order value (AOV) by offering product bundles and volume discounts. Set a minimum spend threshold to unlock free shipping for customers. You can also upsell premium products and cross-sell related items in the cart. These strategies encourage shoppers to spend more, directly boosting your AOV. Let’s be honest, the whole game of running […]
The Real Technical Split: Pre- vs. Post-Purchase Upsells
A pre-purchase upsell is an offer shown before a customer pays, modifying the current shopping cart. A post-purchase upsell is an offer shown after a customer completes payment, creating a new, separate transaction. The main difference is the timing of the offer relative to the initial payment and its effect on the order. On the […]